These are some of the problems that I found along the way:
- Not so serious nominations. This lead to the installment of Steve Eagleton as the Newcastle representative.
- Lack of participation. This meant that some teams unfairly voted against their player in the end if their participation in the poll was high but the polls of other forums (where their players were) was not so high.
- Multiple voting. i.e. Not being able to vote for your player at your forum but voting for your player at another forum.
- Stuffing up the Perth poll. I didn’t put Che Bunce as an option, but did put Colosimo. Guess who got the most votes there.
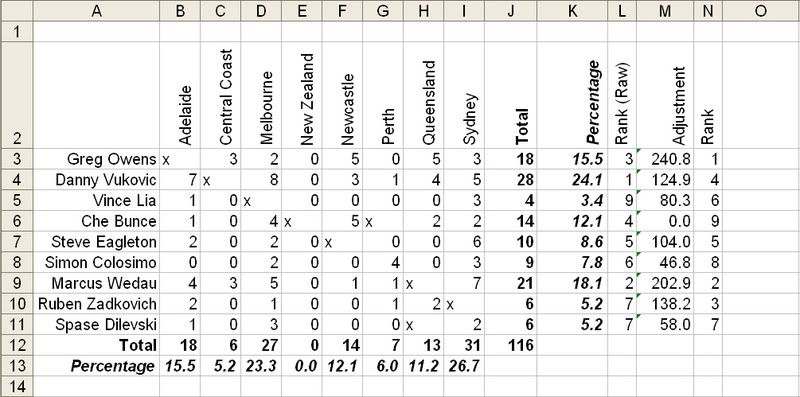
Problem #2 was fairly evident. As you can see in the spreadsheet below, Melbourne and Sydney forums had the most active participation. And so were giving lots of votes to other teams without really receiving any for theirs (fair enough too, considering the Sydney and Melbourne reps!) The Newcastle forum involved posts urging the boycott of the poll as Eagleton was not an option to them, as I tried to remove any ‘home’ team bias. This works well in a raw data form, because they didn’t end up giving many votes to Eag’s competition.
 So while I had said on each forum:
I'll cumulate all votes once the polls finish. One vote on one forum = one vote on another forum.I’ve changed my mind. Muahahahaha! No, it’s only fair. I had an idea that I mentioned in each forum initially, and have modified it. The original idea:
I did consider a percentage modified count, where I'd consider crowd numbers at matches, but as this isn't reflected in the forum participiation I've decided against it.So I’ve designed a percentage modified count where I’ve considered poll participation numbers!
If you look at the first Excel sheet, above, column J shows the raw number of votes and K, the percentage of votes for each player. Rows 12 and 13 show the number of votes from each forum in a total number and percentage formats. Column M is the product of the percentage vote of each player multiplied by the participation percentage for his ‘home’ forum.
i.e. Greg Owens from Adelaide’s adjustment score is the product of 15.5 (the percentage of votes he got from all forums) and 15.5 (the percentage of votes Adelaide forumites put in compared to all forums.)
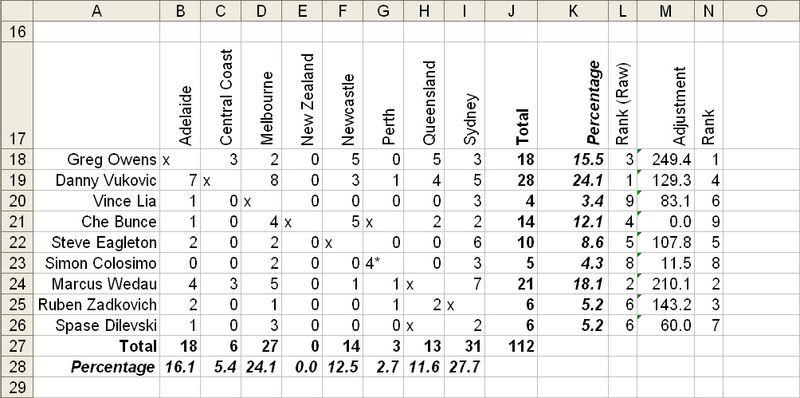
This means that Che Bunce automatically came last as I didn’t put a poll up in the New Zealand forum as they weren't all that receptive in the first place. As a result, this also helped out problem #4, because it didn’t matter how many votes Perth may have given him. Making this 'adjusted score' also somewhat rectifies a bit of problem #2 - a vote on another forum increases that forum's participation percentage and consequently the adjusted score for that forum's 'home' player.
However, Colosimo still had votes at Perth. Lucky for me, the Perth participation was so low that he came 2nd-last regardless of if I did or didn’t count his votes from the Perth forum (compare Excel sheets 1, above, and 2, below.) In fact, the adjusted rankings didn’t change at all for any players!
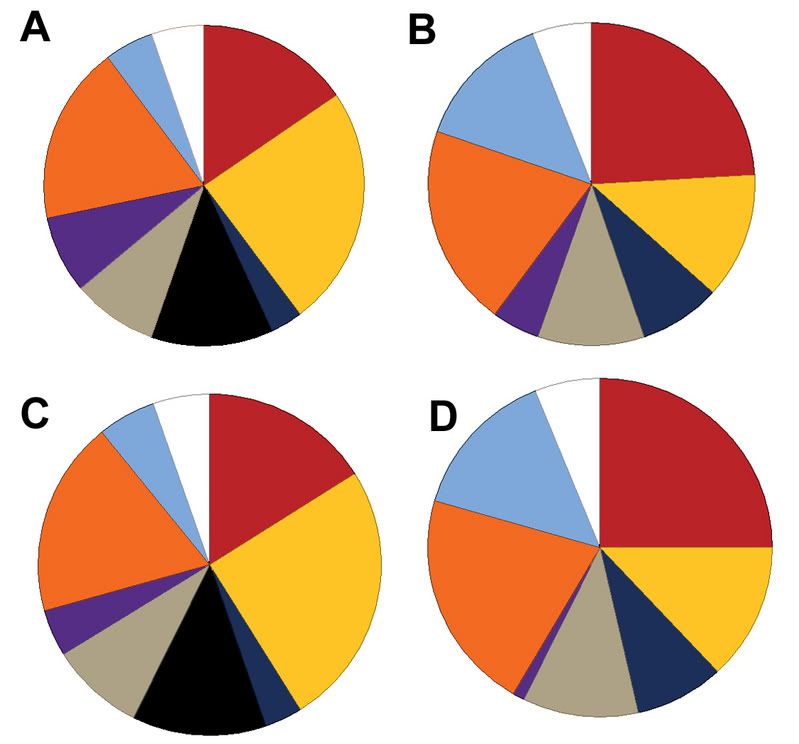
So there are actually two winners for the "best looking bloke award!" One based on raw data, as promised on each of the forums. The other based on the method outlined above. The charts below show the results. A and B include the votes given to Colosimo by the Perth forum, C and D do not. The A and C are the raw data, the B and D shows data from the adjusted score method.
So our winners are...
Danny Vukovic and Greg Owens!
Our "raw data" winner: Danny Vukovic (what's not to like about a goalkeeper?)
 A good player, always switched on, seems to have quite a bit of character.
Oh, and is kinda cute too.

I'll make it known that I voted for him on the MV forum as a bit of a oh I can't decide but the Central Coast have got good taste as they only voted for Wedau and Owens why not give my vote to Danny as he's quite cute kind of vote.
 And on when CC nominations were up I selected Alex Wilkinson over Danny. Sorry, couldn't resist putting this picture up - I only just found it! Good defender too - and definitely the cutest A-League captain.
Our "adjusted score" winner: Greg Owens (has a bit of a rash temper when he's playing, but if we're just looking I suppose it doesn't matter that he scored against us. Not that it matters any more.)
 You can see that he's not a bad looking sample of an A-League player
 here on the left...
But Greg, covering up your face isn't going to help us!
And it's really quite difficult to look away when he's got that grin...

Note: all pictures linked to their appropriate homes on the A-League club sites.
P.S. Allsopp looked REALLY good at Fed Square today, but no, the Tards had to pick Vinnie Lia... and where'd he come in the raw data? LAST! Buahahahahahaha! Can't say too much really, he ended up beating Spase in the adjusted score, but I think that has more to do with the high participation rate of MV. Maybe I should have adjusted the participation rate with crowd numbers, so that smaller clubs 'get a chance.'...
4 comments:
Oooh - my new method's soooo much better! Because I've now standardised forum participation in the poll with respect to crowd numbers. So it's a level playing field in terms of fan base!
So working with Owens...
Adelaide's average crowd was 11.8% of the average A-League crowd. Forum participation in poll was 16.1% of total participation. So the 'poll participation factor' is 16.1 divided by 11.8, giving 1.365. The players adjusted score is the product of the poll participation factor and the percentage of votes he received. i.e. 1.365x15.5.
The final scores are:
1. Owens (21.2 pts)
2. Vukovic (13.6 pts)
3. Wedau (13.2 pts)
4. Zadkovich (9.9 pts)
5. Eagleton (9.7 pts)
6. Dilevski (3.8 pts)
7. Lia (3.1 pts)
8. Colosimo (1.6 pts)
9. Bunce (0 pts)
Muahahaha - now Dilevski's beaten Lia. Is the method sound, or do I prefer the outcome achieved by it?
those pie charts are cool - hmmm, erotic cakes, hmmmm.....you're incorrigible girl! What's next, performance analysis?
Cecillia, you really have too much time on your hands. Good piece of work - attach to your CV - time to get a real job! Go Victory!
those pie charts are cool - hmmm, erotic cakes, hmmmm.....you're incorrigible girl! What's next, performance analysis?
What kind of performance analysis? *insert winking emoticon here*
Cecillia, you really have too much time on your hands. Good piece of work - attach to your CV - time to get a real job! Go Victory!
1st. It's Cecilia - one L.
2nd. I do have a real job. As a scientist, hence my facination with charts and methodology.
And yes, go Victory!
Oh, I forgot the legend for the charts - it's pretty easy, each colour is related to the team represented by each player. Except Spase, who's white. See legend here!
Post a Comment